Remote debug live content on an Android device from your Windows, Mac, or Linux computer. This tutorial teaches you how to:
Set up your Android device for remote debugging, and discover it from your development machine.
Inspect and debug live content on your Android device from your development machine.
Screencast content from your Android device onto a DevTools instance on your development machine.
Requirements
Chrome 32 or later installed on your development machine.
USB drivers installed on your development machine, if you’re using Windows. Ensure Device Managerreports the correct USB driver.
A USB cable to connect your Android device to your development machine.
Android 4.0 or later.
Chrome for Android installed on your Android device.
Step 1: Discover your Android device
On your Android device, select Settings > Developer Options > Enable USB Debugging. Developer Options is hidden by default on Android 4.2 and later. See Enabling On-Device Developer Options to learn how to enable it.
On your development machine, open Chrome. You should be signed in to Chrome with one of your Google accounts. Remote debugging does not work in Incognito Mode or Guest Mode.
In DevTools, click the Main Menu then select More tools > Remote devices.
In DevTools, click the Settings tab, if another tab is showing.
Make sure that Discover USB devices is enabled.
Connect your Android device directly to your development machine using a USB cable. Don’t use any intermediate USB hubs. If this is your first time connecting your Android device to this development machine, your device shows up under Unknown, with the text Pending Authorization below it.
If your device is showing up as Unknown, accept the Allow USB Debugging permission prompt on your Android device. Unknown is replaced with the model name of your Android device. The green circle and the Connected text indicate that you are all set to remotely debug your Android device from your development machine.
Step 2: Debug content on your Android device from your development machine
If you don’t already have Chrome open on your Android device, open it now.
Back in DevTools, click the tab that matches your device’s model name. At the top of this page, you see your Android device’s model name, followed by its serial number. Below that, you can see the version of Chrome that’s running on the device, with the version number in parentheses. Each open Chrome tab gets its own section. You can interact with that tab from this section. If there are any apps using WebView, you see a section for each of those apps, too. The screenshot below does not have any tabs or WebViews open.
Next to New tab, enter a URL and then click Open. The page opens on a new tab on your Android device.
Click Inspect next to the URL that you just opened. A new DevTools instance opens. The version of Chrome running on your Android device determines the version of DevTools that opens on your development machine. So, if your Android device is running a very old version of Chrome, the DevTools instance may look very different than what you’re used to.
More actions: reload, focus, or close a tab
Click More Options next to the tab that you want to reload, focus, or close.
Inspect elements
Go to the Elements panel of your DevTools instance, and hover over an element to highlight it in the viewport of your Android device.
You can also tap an element on your Android device screen to select it in the Elements panel. Click Select Element on your DevTools instance, and then tap the element on your Android device screen. Note that Select Element is disabled after the first touch, so you need to re-enable it every time you want to use this feature.
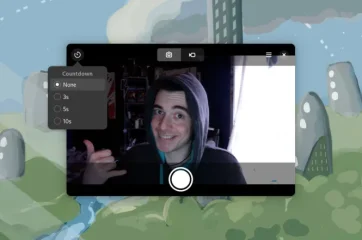
Screencast from Android device to development machine
Click Toggle Screencast to view the content of your Android device in your DevTools instance.
You can interact with the screencast in multiple ways:
Clicks are translated into taps, firing proper touch events on the device.
Keystrokes on your computer are sent to the device.
To simulate a pinch gesture, hold Shift while dragging.
To scroll, use your trackpad or mouse wheel, or fling with your mouse pointer.
Some notes on screencasts:
Screencasts only display page content. Transparent portions of the screencast represent device interfaces, such as the Chrome omnibox, the Android status bar, or the Android keyboard.
Screencasts negatively affect frame rates. Disable screencasting while measuring scrolls or animations to get a more accurate picture of your page’s performance.
If your Android device screen locks, the content of your screencast disappears. Unlock your Android device screen to automatically resume the screencast.

 then select More tools > Remote devices.


 on your DevTools instance, and then tap the element on your Android device screen. Note that Select Element is disabled after the first touch, so you need to re-enable it every time you want to use this feature.
 to view the content of your Android device in your DevTools instance.
You can interact with the screencast in multiple ways:
to view the content of your Android device in your DevTools instance.
You can interact with the screencast in multiple ways:


Thanks for this info Anish, fantastic job by the chrome & Android devs. No more nasty surprises in web apps, as far as Android phones are concerned.
Thanks Joel for suggesting this article.